Tuesday, 16 July 2019|Source:CHINA CHAMBER OF COMMERCEFOR IMPORT&EXPORT OF MEDICINES &HEALTH PRODUCTS|Author:
From 2014 to 2016, the Russian economy has been trapped in negative growth. In 2017, it gradually emerged from the economic downturn. According to the World Bank report, Russia achieved an economic growth rate of 1.5% in 2018, the same level as 2017. Supported by the rising of oil prices, Russia and other oil exporters maintained steady growth in 2018. It is expected that by 2020 and 2021, GDP growth rate of Russia will climb to 1.8%.
Russia has always been an important economic cooperation partner of China. In 2018, the bilateral import and export trade reached a record US$107.06 billion, exceeding US$100 billion for the first time, up by 20.1% than last year, of which exports and imports of China were US$47.98 billion and US$59.08 billion respectively, a year-on-year increase of 12% and 42.7% separately.
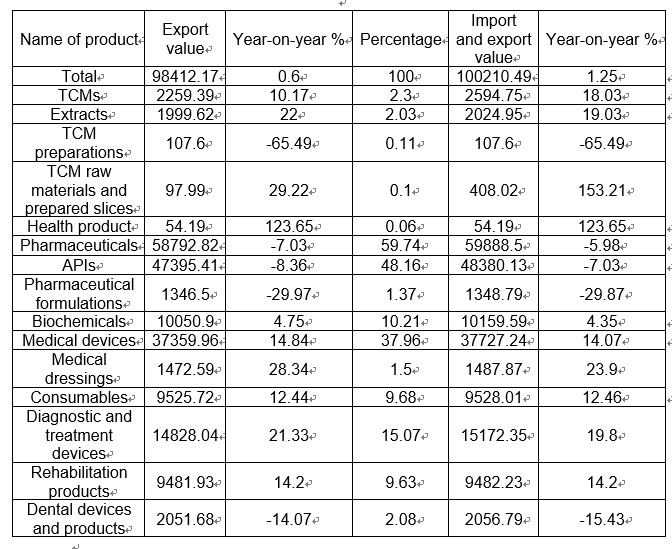
As an emerging pharmaceutical market, Russia has been highly concerned and developed. The bilateral cooperation in the pharmaceutical field between China and Russia also rushes in growth year by year, and bilateral trade is developing healthily. Although there was a decline in 2014, the upturn of Russia’s economy in 2017 greatly promoted the recovery of bilateral pharmaceutical trade. In 2018, the overall growth was basically the same as 2017 due to the sharp decline in the exports of pharmaceuticals. According to import and export statistics from China Customs, the bilateral pharmaceutical trade value in 2018 was US$1.002 billion, up by 1.25% year on year, of which our exports were US$0.984 billion, increased by 0.6% than last year (see Table 1).

Table 1: Statistics on China-Russia Pharmaceutical Trade in 2018 (in 10,000 USD) (Source: Statistics from China Customs, Royal DSM, and Ministry of Industry and Trade of the Russian Federation)
Current Status of China-Russia Pharmaceutical Trade
The export of APIs dropped significantly
Our exports of APIs to Russia encountered another decline in 2018 after the first decline in 2015, which led to an overall decline in the export of pharmaceuticals, down by 7.03% than the last year. The export value totaled US$588 million in 2018, of which APIs exports were US$474 million, up to 8.63% decline than the last year, which was mainly attributed to the decrease in order quantity of several major export companies given the poor financial situations of their Russian customers.
The export of medical devices recovered
China’s exports of medical devices to Russia turned up in 2017 and obtained satisfactory result in 2018, with export value of US$374 million, an increase of 14.84%. Despite the decline of dental devices, the export of other medical devices enjoyed a promising trend of growth. For many years, pharmaceutical products, especially APIs, have always taken the largest proportion of our exports to Russia, even accounting for nearly a half. However, with the acceleration of the localization of Russian pharmaceutical industry, it will become increasingly difficult for our export of pharmaceutical formulations to Russia. At present, 80% API demands of the Russian pharmaceutical industry still rely on imports. In 2015, the Ministry of Industry and Trade of the Russian Federation introduced the policy of supporting API companies and more than 10 API projects were launched, but Russia’s dependence on API imports will not change in the short term. Therefore, it is reasonable that China, as the largest API supplier for Russia, will usher in a recovery of its exports of APIs to Russia later in spite of the decline in the first half of the year.
Russian pharmaceutical market environment
Market size further expanded
Although Russia has been trapped in economic downtown in recent years, its localization process in the food and pharmaceutical industries has accelerated, and these industries have become economic blocks with rapid growth rate. According to Russian company DSM, the Russian pharmaceutical market achieved a year-on-year increase of 1.8% in 2018, reaching 1.66 trillion rubles, or about US$25.5 billion. Since Russia proposed the Strategy for the Revitalization of Local Pharmaceutical Industry in 2009, over 40 new pharmaceutical plants have been built and production has tripled to nearly 300 billion rubles.
Import substitution had remarkable results
In 2017, Russian domestic pharmaceuticals played an increasingly important role in the market due to the great efforts of local companies and the successful implementation of import substitution policies.
According to the information provided by the Economic and Commercial Counsellor’s Office of the Embassy of the People’s Republic of China in the Russian Federation, since Russia’s implementation of the Strategy for the Revitalization of Local Pharmaceutical Industry in 2009, multinational pharmaceutical companies have made significant contributions to the development of the Russian pharmaceutical industry and economy in the past decade, and have also achieved great success. The investment of about 119.7 billion rubles focused on localized production, modernization of pharmaceutical production facilities, technology transfer, research and development, and clinical trials. Driven by various forms of localization, Russian pharmaceutical industry has grown at an average annual rate of 10% in recent years, and the market share of domestic pharmaceuticals has climbed from 15% to 33%.
Stricter GMP management was implemented
Since the implementation of GMP management in Russia in 2016, 40 GMP applications have been received from China, among which 12 have been approved, 14 rejected, 8 withdrawn and 6 still under review. To ensure the pharmaceutical safety of the Russian people and the further improvement of pharmaceutical quality, the improvement and stricter implementation of the GMP review system will greatly affect the export of our APIs and biochemicals to Russia, indicating the bottleneck period on the way.
Source: CCCMHPIE